As we look toward next week’s December employment report, we must critically evaluate the distortions that defined the November unemployment rate. While the headline figure rose 12.5bp between September and November—seemingly providing clear evidence that unemployment was breaking out of its established mid-2024 range—our forensic analysis suggests this move was heavily polluted. We estimate that federal government developments accounted for roughly half of that increase, of which at least 4bp is a statistical “phantom” poised to reverse in December. Furthermore, the logistical anomaly of interviewing households for the first time in November who were originally scheduled for October likely imparted a significant upward bias, though the exact magnitude remains a subject of intense debate among desk analysts.
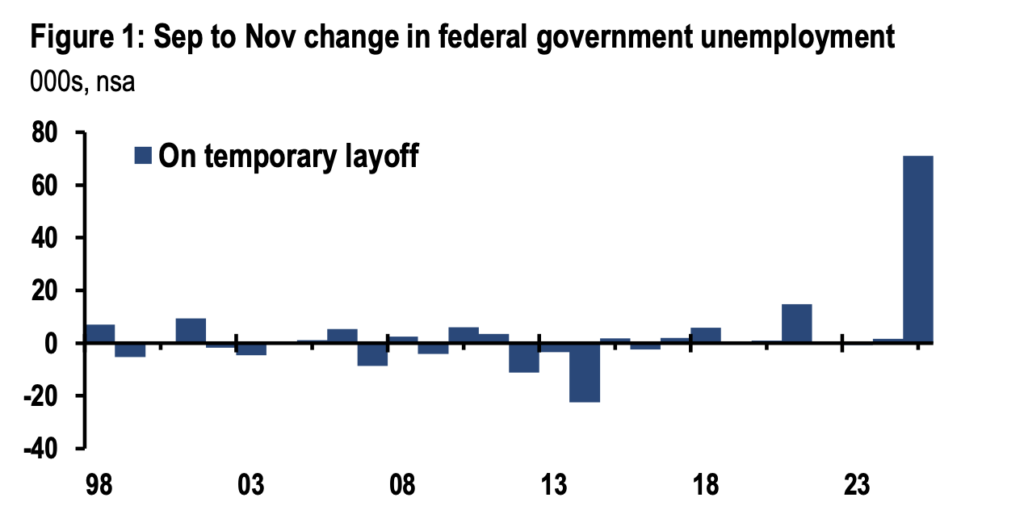
The primary driver of this noise was the federal government shutdown. Under standard BLS definitions, a worker on furlough should be counted as unemployed only if they did not work at all during the reference week. Since federal employees officially returned to work on Thursday, November 13, they should have been recorded as employed. However, the data suggests a widespread misclassification. By digging into the Current Population Survey (CPS) microdata, we identified a surge in individuals claiming to be on “temporary layoff” whose last workplace was the federal government. This non-seasonally adjusted figure spiked by 71k this year, compared to a historical average of near zero. This misclassification alone likely padded the unemployment rate by 4bp—a distortion we expect to see completely unwound in the upcoming December report.
We also addressed the 70bp spike in the alternative U6 measure. While the surge in “part-time for economic reasons” often signals a cyclical downturn, some suspected it was merely an artifact of furloughed federal workers. Our analysis refutes this: federal employees accounted for only 5% of that increase. This suggests that while the headline (U3) rate is noisy, the U6 spike represents a genuine, albeit subtle, softening in private-sector labor utilization. Simultaneously, the end of the federal deferred resignation program saw 162k employees exit payrolls in October.
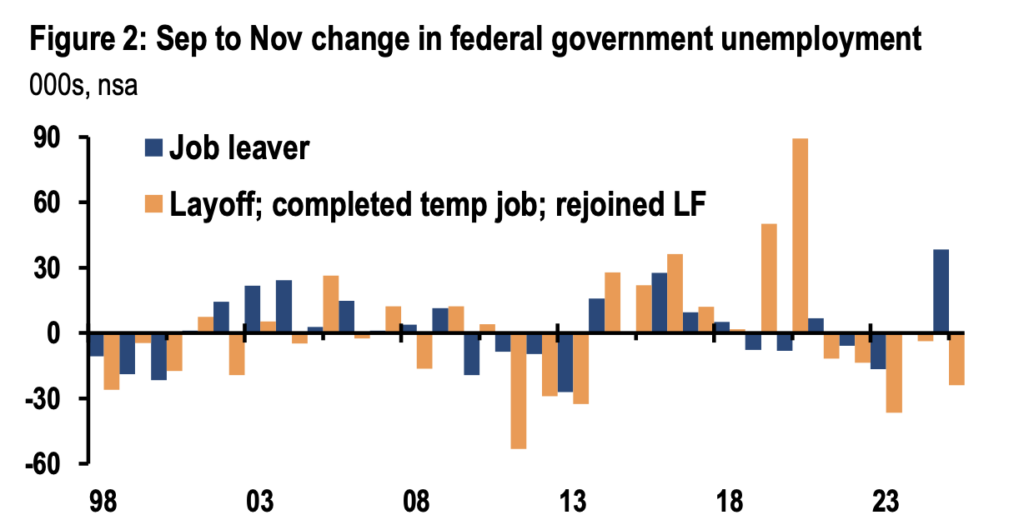
While a “worst-case” flow analysis suggested a 9bp hit to the unemployment rate, our microdata tracking shows only 40k new unemployed job leavers. This contributed a modest 2bp to the rate—a move that is structural and likely to persist, unlike the shutdown noise.
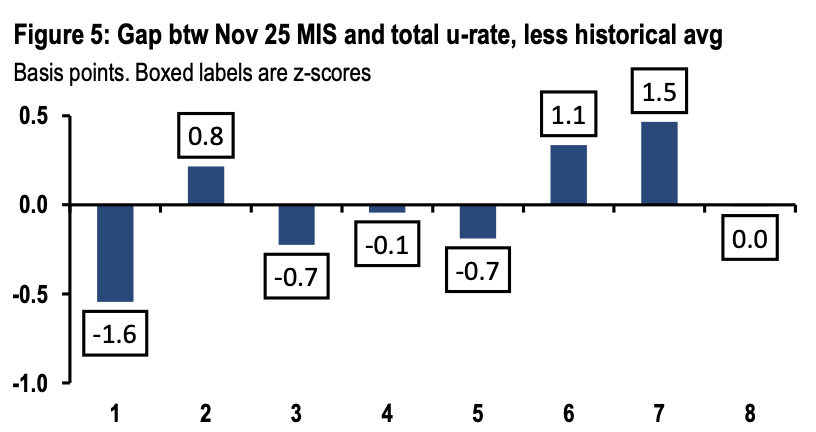
Finally, we must account for “rotation group bias,” which was exacerbated by the canceled October survey. November saw a double-weighting of Month-in-Sample (MIS) 1 and 2 groups—respondents who are statistically prone to reporting higher unemployment. The data shows that the unemployment gap for these specific cohorts was 1.6 standard deviations above the 10-year average.
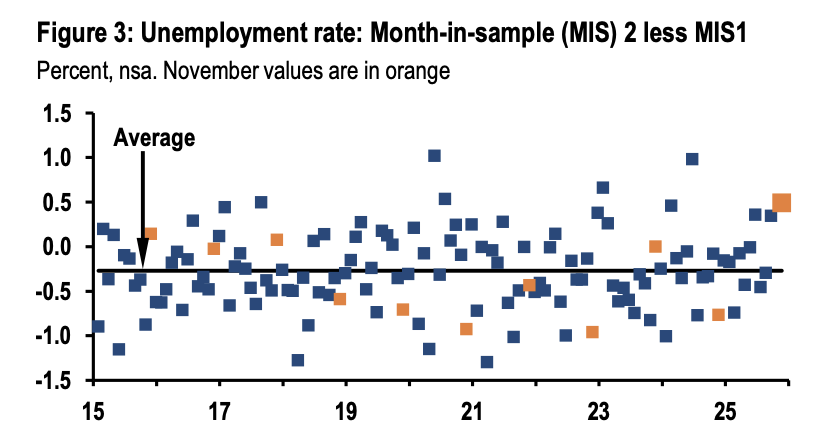
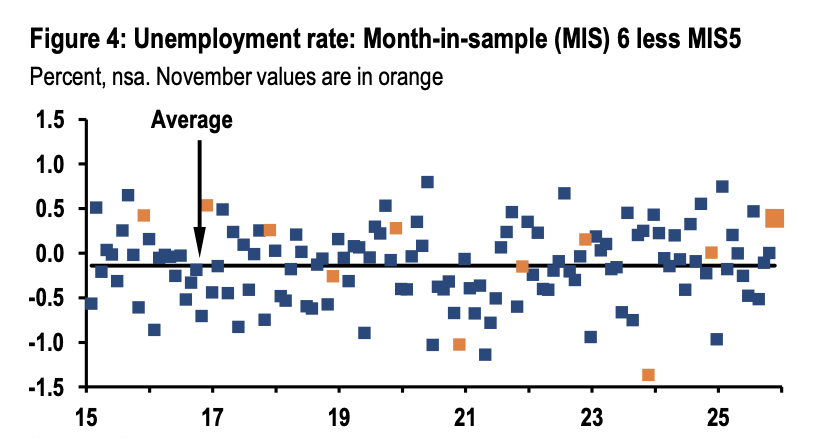
A blunt mathematical adjustment would imply a massive 16bp upward bias; however, as seasoned analysts, we view such a high conviction conclusion with caution. The MIS 1 rate was unusually low relative to the total, suggesting the “noise” is multi-directional. Ultimately, the November “breakout” looks increasingly like a collection of technical anomalies. As these factors mean-revert in December, the market may be surprised by an optical “improvement” that is actually just a return to a cleaner, though still slowing, baseline.